
Vehicle Aerodynamics Analysis
A full-car external aerodynamics study on a Formula 1 car at race speed, presented the way it would be for a client program: what the airflow is doing, where the performance comes from, and what it means for the design.
Overview and objectives
This study covers a complete external-aero simulation of a full F1 car at 50 m/s (180 km/h), with a moving-ground plane so the ground-effect physics come through correctly, instead of relying on a static-floor approximation.
The mesh is refined heavily around the car: 11.3 million cells, five boundary layers, with the first cell close enough to the surface to resolve real detail in the flow right at the body.
The objective wasn't a pretty picture. It was to answer the three questions any performance program cares about: where downforce is actually coming from, where drag is being paid for it, and where there's room to improve the balance between the two.
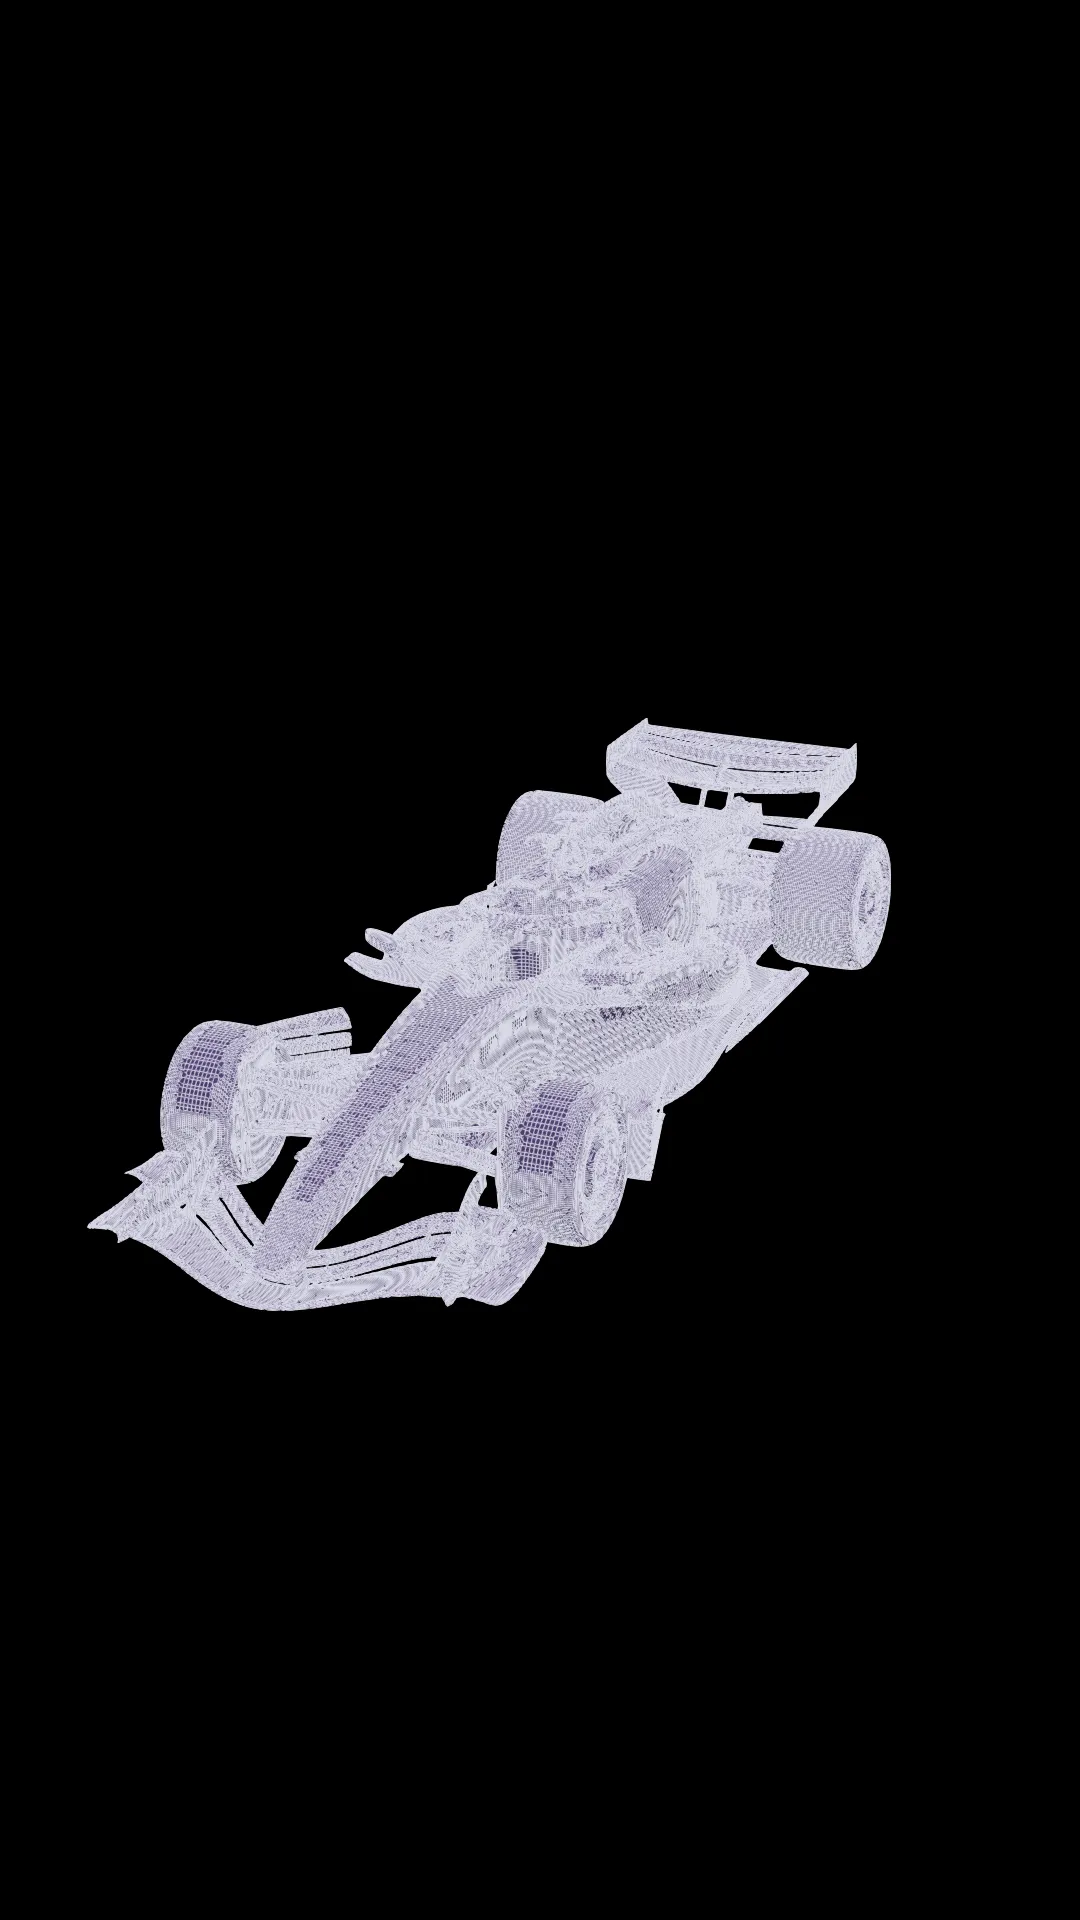
Vehicle external flow analysis
Once the simulation is running, the first useful view is the full picture: how air moves over, under, and around the entire car at once, rather than one cross-section at a time.
That whole-vehicle view matters because components don't work in isolation. A change that looks good on a front wing by itself can still cost more downstream than it gains once the rest of the car is accounted for.
Front aerodynamic components
The front wing does its share of the work (about 28% of the car's total downforce comes from it), but it's also where the car's aerodynamic story begins.
Vortices roll off the wing almost immediately and get carried downstream: real, rotating structures that travel the length of the car and shape how air behaves at the wheels and along the floor further back.
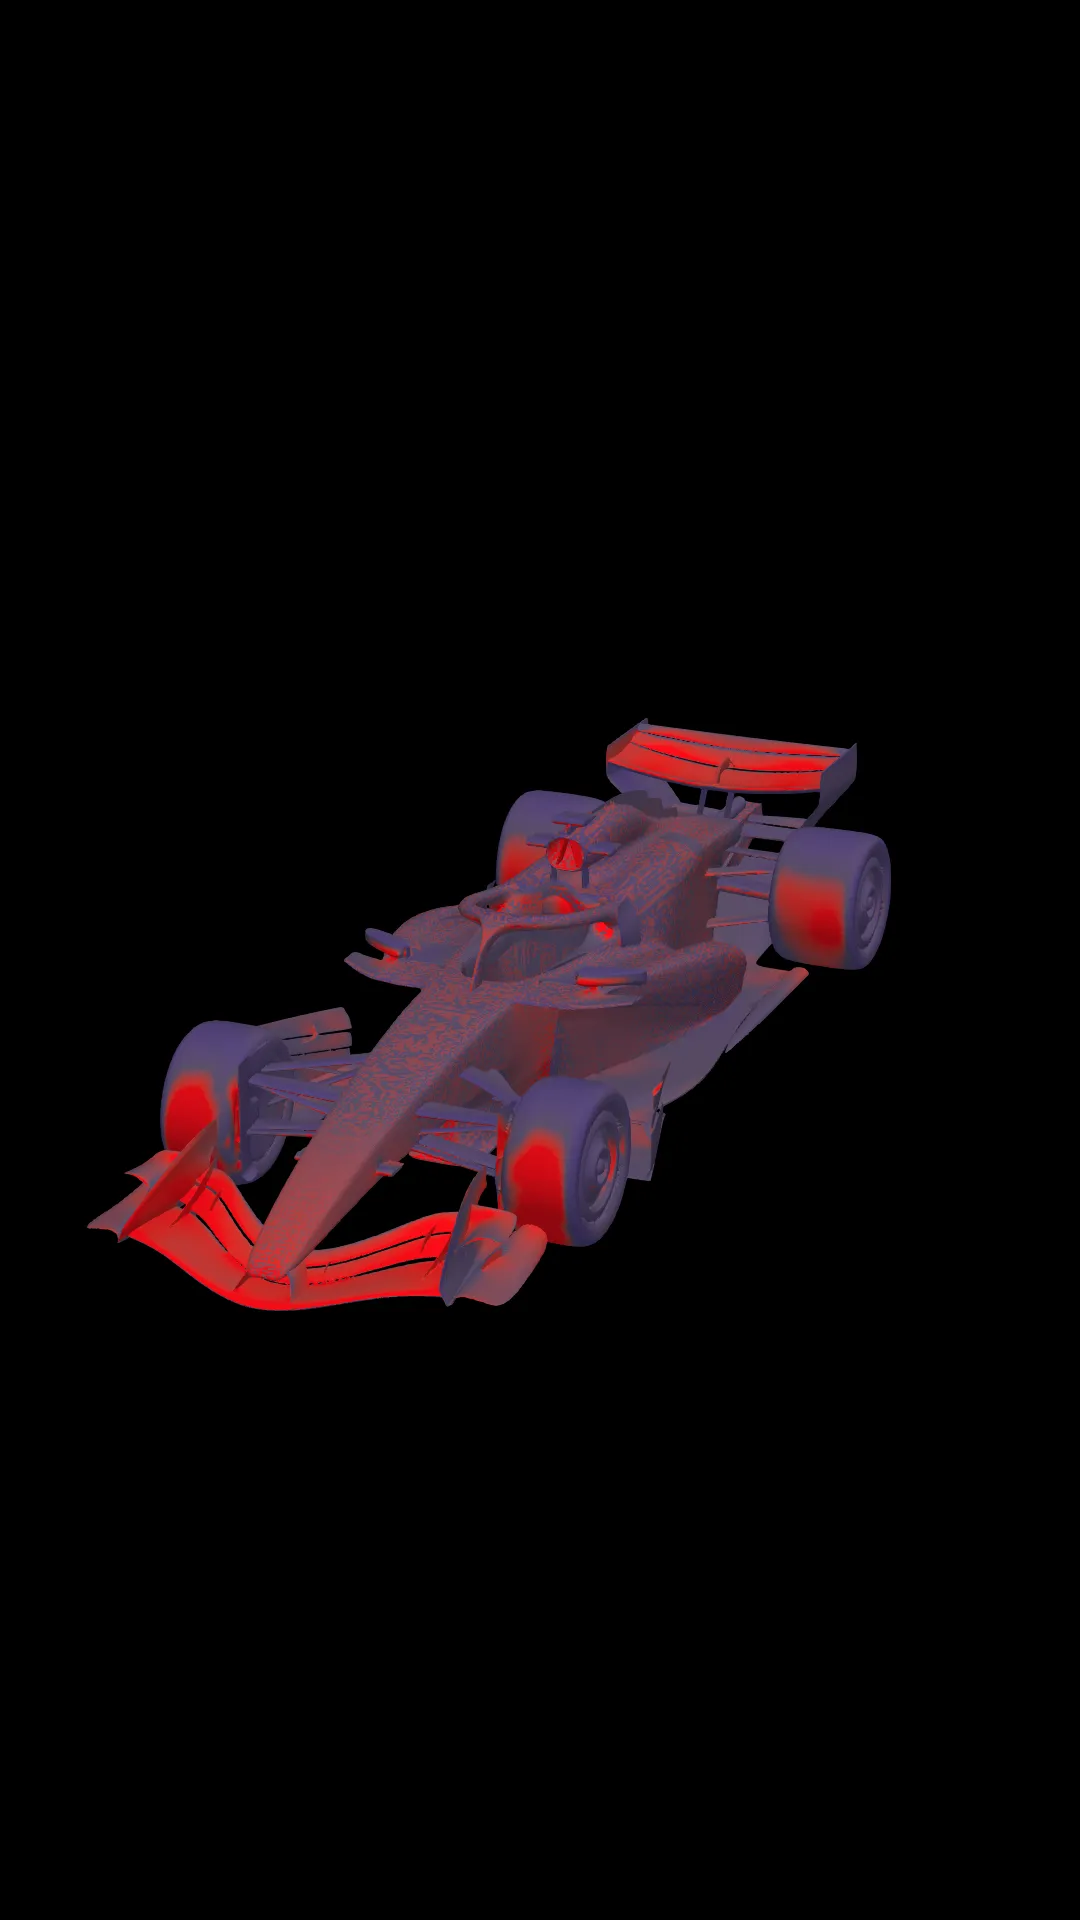
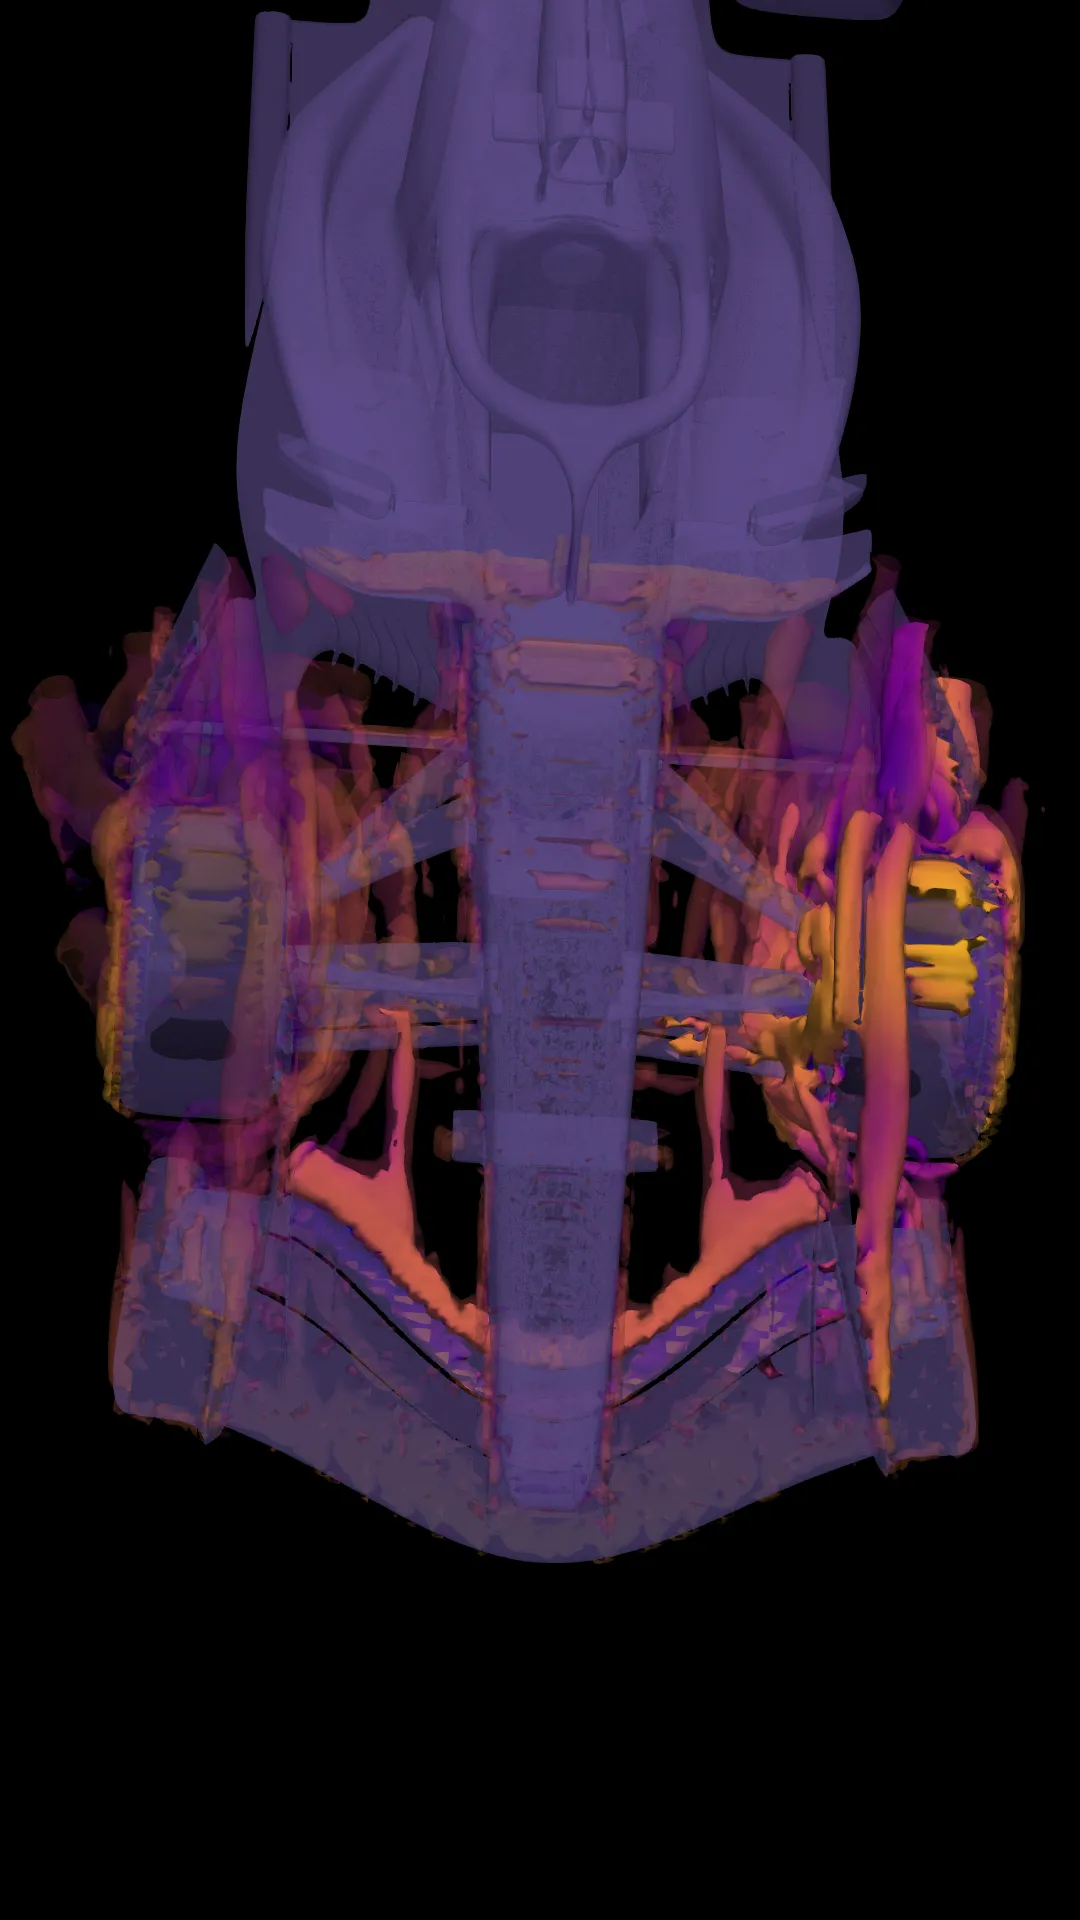
Side flow and wheel wake
An exposed, spinning wheel churns the air more than almost anything else on the car. It's consistently the single most turbulent region in the whole simulation.
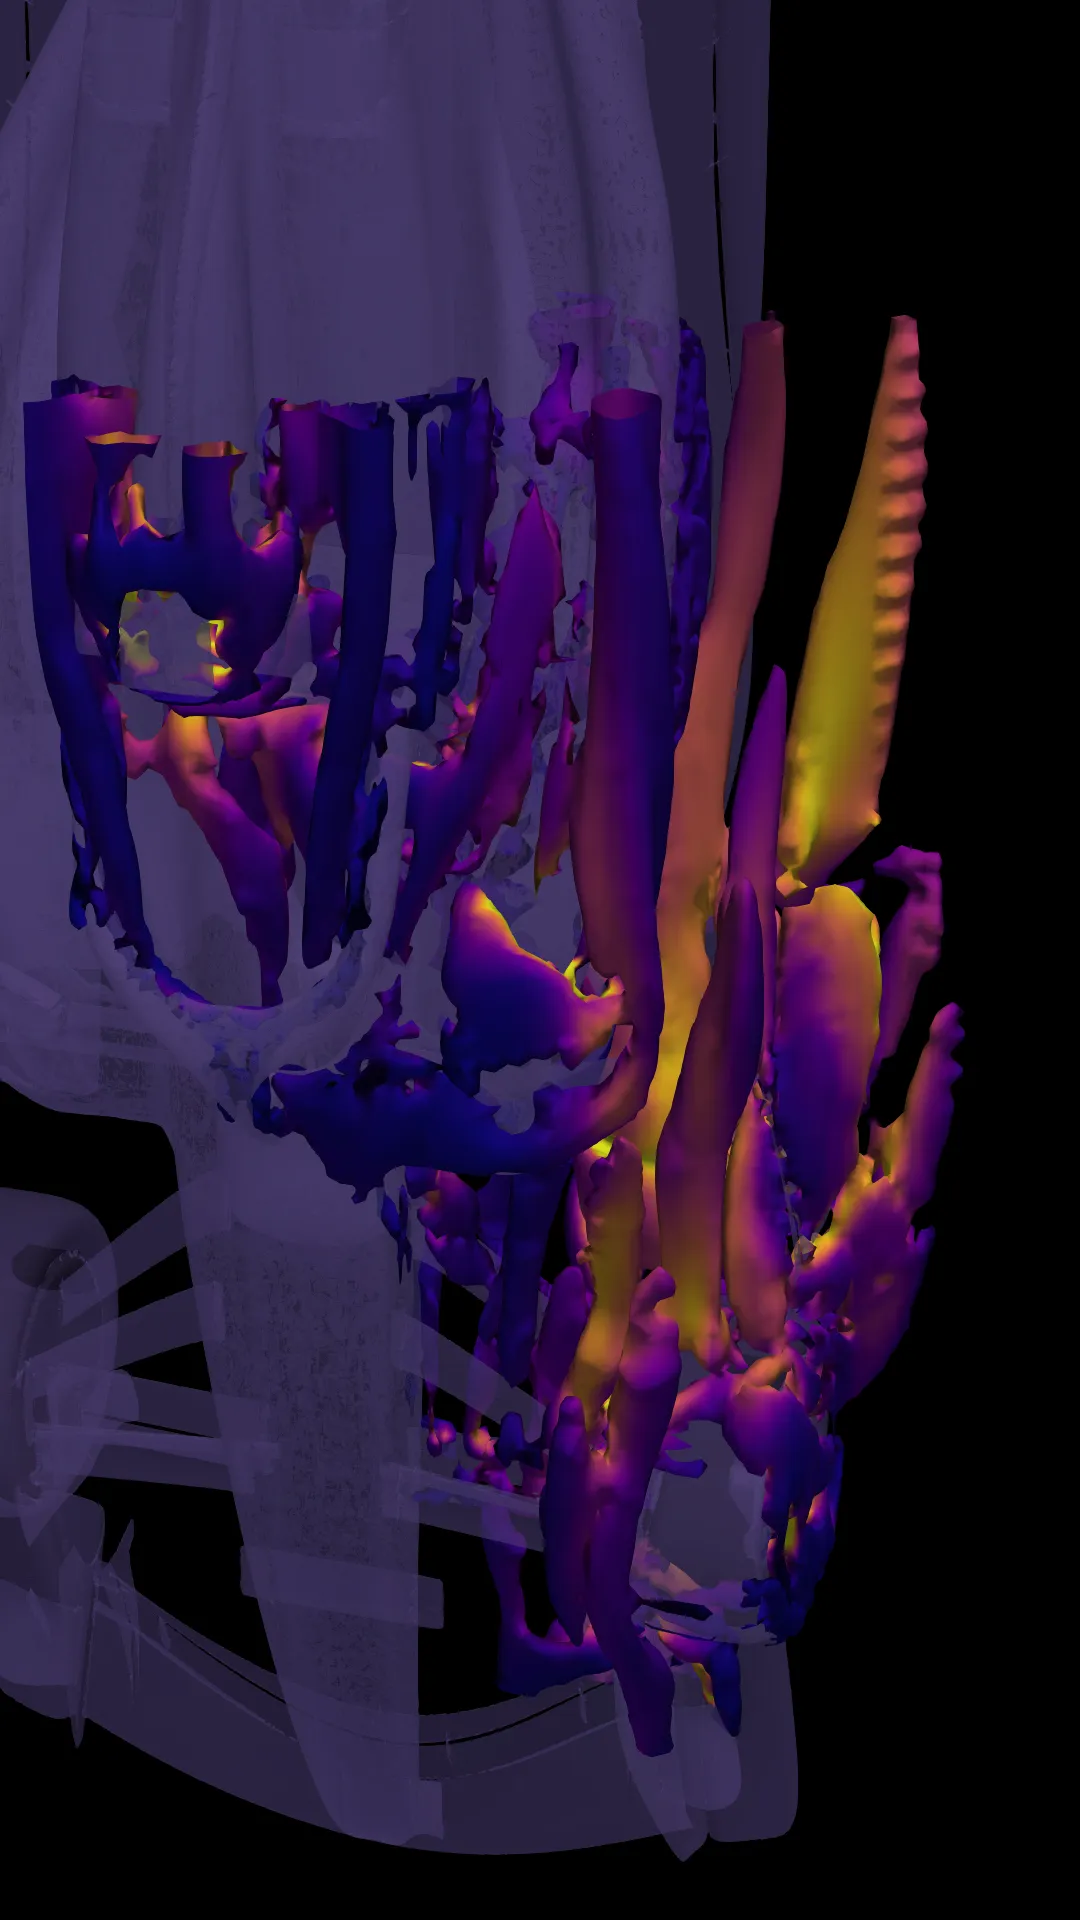
That turbulence isn't just a smear in the air. It's organized into real, rotating vortex structures peeling off the wheel and carrying downstream, which is exactly the kind of interaction that has to be accounted for anywhere else on the car that sits in a wheel's wake.
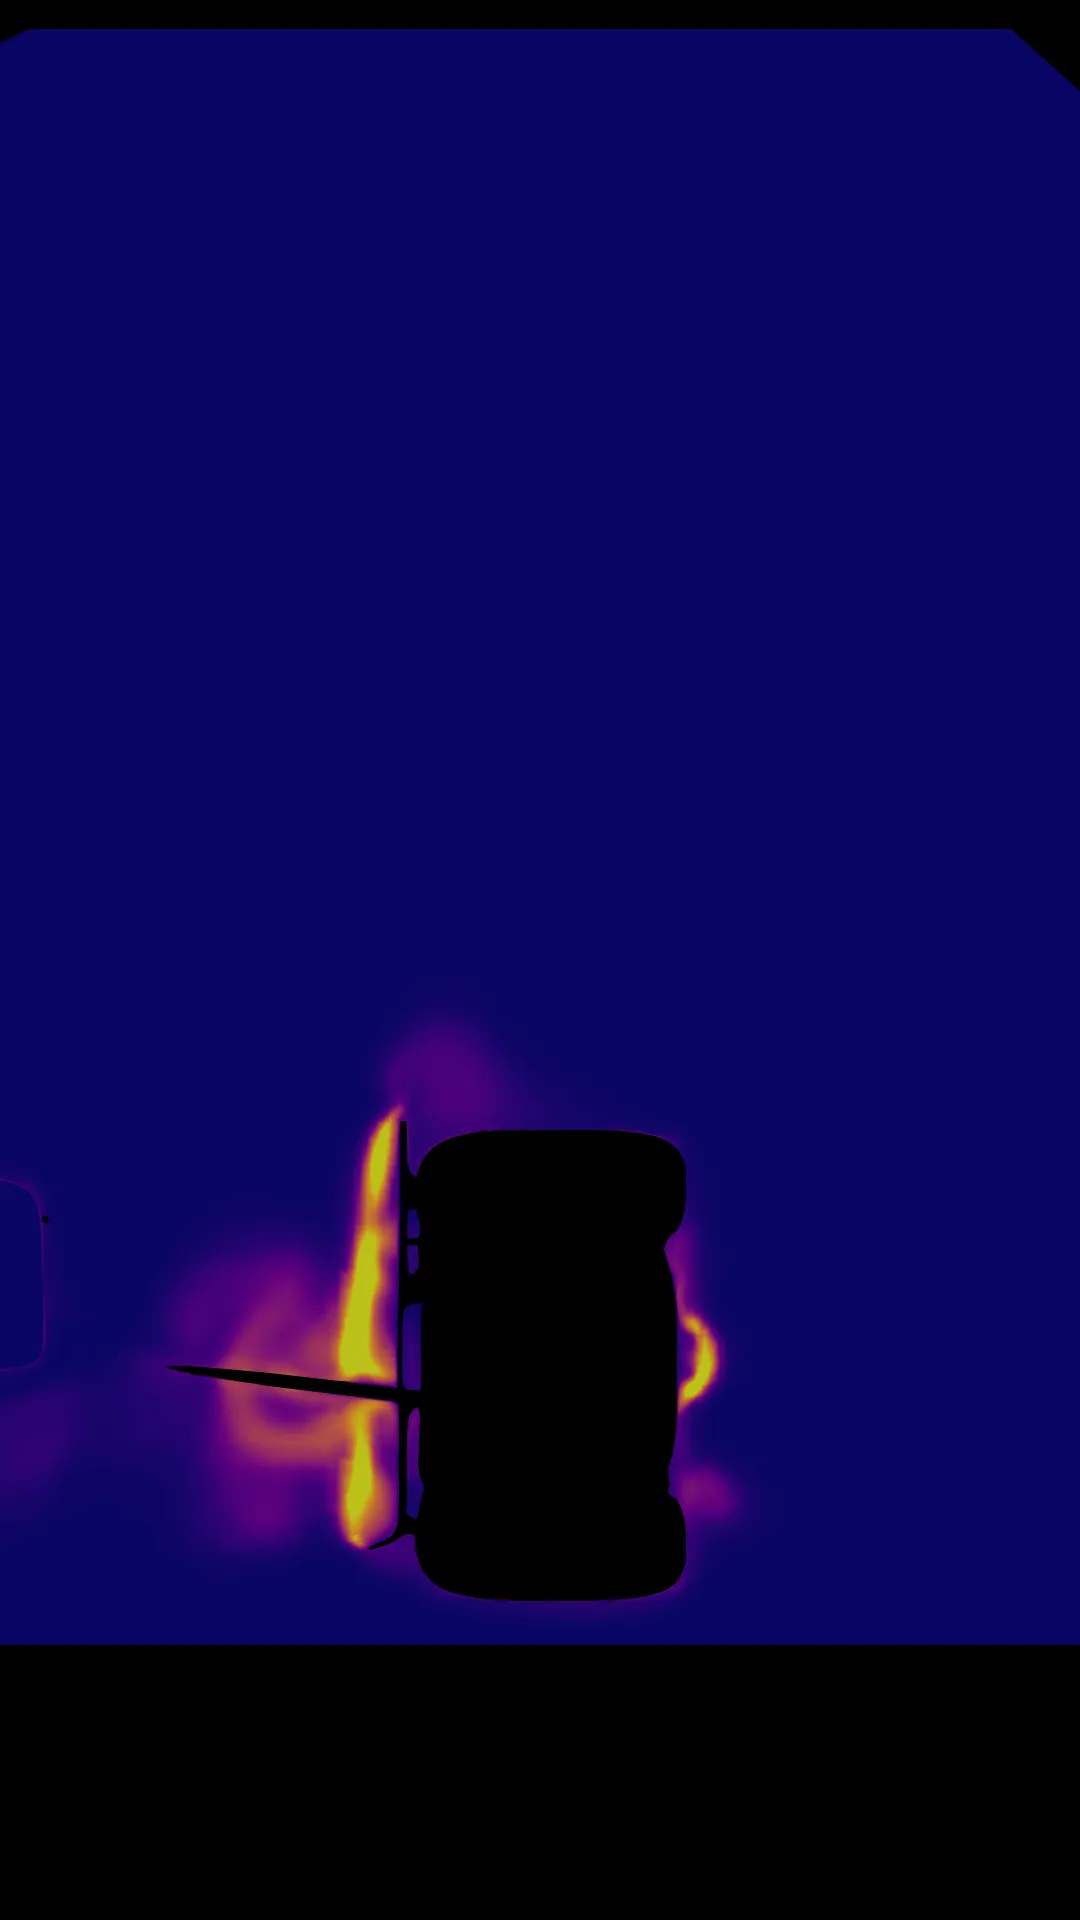
Rear wake analysis
By the time air reaches the back of the car, the rear wing and diffuser are doing the majority of the work (roughly 72% of the car's total downforce comes from the back half alone).
All the rotational activity generated further forward, off the front wing and around the wheels, stretches, travels, and rolls up into one coherent, turbulent wake behind the car.
Pressure and velocity visualization
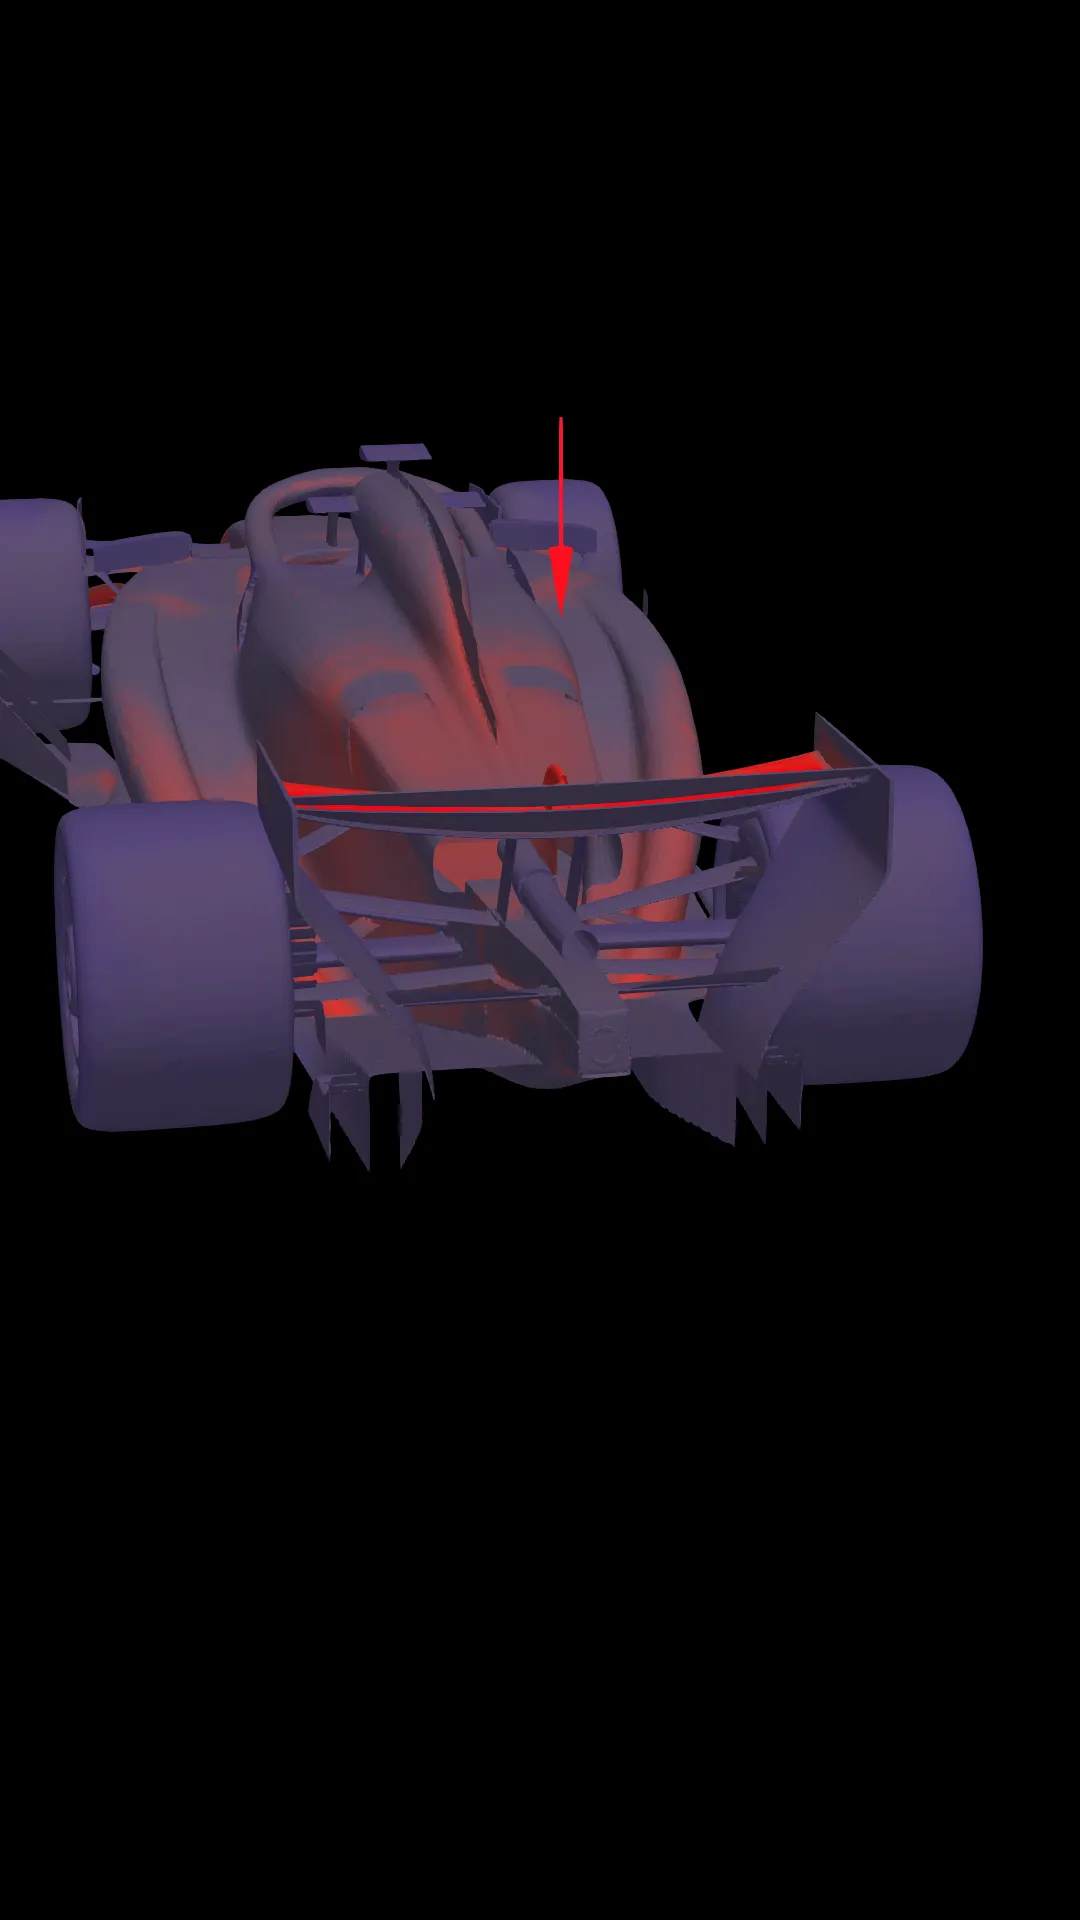
Most of what shows up as drag and downforce on a car like this comes from pressure, not surface friction: in this study, pressure-driven forces outweighed skin friction by roughly 19 to 1.
The floor is where that shows up most. Squeezing air through the centimeters-tight gap between the underbody and the track accelerates it, almost exactly like a venturi, and that acceleration is what pulls the car into the road.
Key aerodynamic observations
The visuals tell the story; these are the numbers behind it, at 50 m/s (180 km/h):
Every one of these numbers points at a specific design decision: where to add load, where to cut drag, and where the two trade off against each other.